23/24: GW17 Notes
Analytics on MD17 and beyond.
Hi 👋
Premier League Data Page Update
GW 17 - 22 Team Goal and Clean Sheet Projections
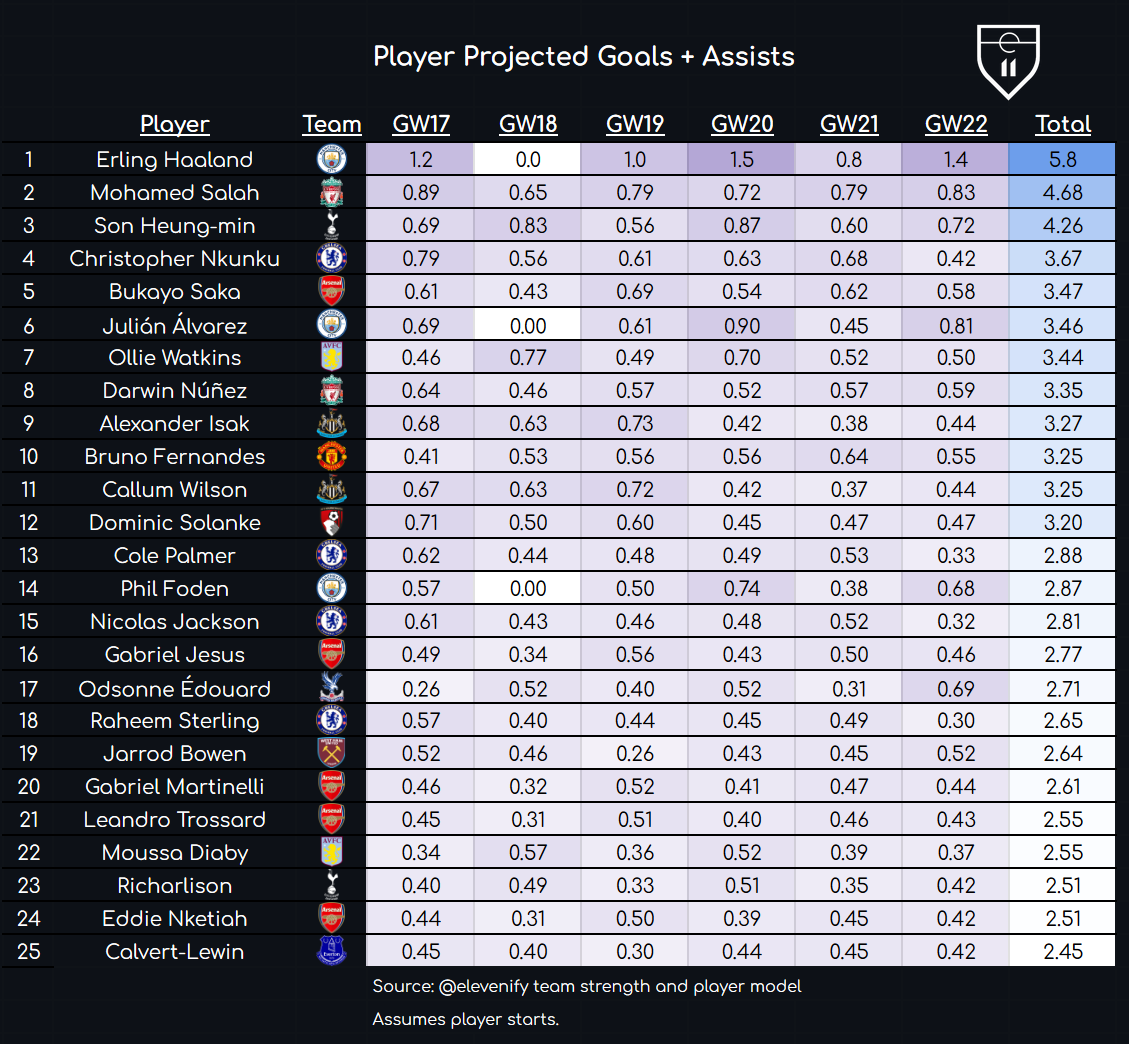
GW 17 - 22 Player Goal Involvement Projections
Team npxG per game 22/23 to 23/24
1. Premier League Data Page Update
The data projections page (link here) has received a fresh update:
All visualisations have been replaced by automatically updating, sortable, searchable tables.
Player lists have been extended to the top-40. Top 50 coming soon.
All data is downloadable in CSV format.
Here is an example of searching the projected goals table for Mitoma:
Please check it out and let me know what you think. If you would like access to the full page, reply to this email or send me a Twitter DM with the email you are subbed with and I will gift you 7 days of access - no commitment.
2. GW 17 - 22 Goal and Clean Sheet Projections
Notes:
It is a testament to Man City’s strength that they continue to top these tables with a blank in GW18. GW14 was a rare week where Liverpool, Arsenal and Newcastle all had nice enough fixtures that City were 4th with the blank. Now those fixtures have passed it is back to business as usual.
Everton who are flying high in the model are about to go into a mixed run of offensive fixtures. To put it in perspective, an average Premier League team would only be expected to score 5.6 goals over the next 6-game run Everton have.
Conversely, Chelsea go into the nicest relative 6-game offensive run. A good time for Nkunku to come into the side.
3. GW 17 - 22 Player Goal Involvement Projections
Notes:
Christopher Nkunku joins the lists now there is a realistic chance of him playing. Goes straight into 4th here.
Despite being slaughtered in my model, I find it very impressive how Bruno stays resilient in the player-level projections.
Arsenal continue to be interesting on a player level, with the returns being very spread across the board.
4. npxG per game 22/23 to 23/24
I enjoyed this graphic from The Athletic. It shows the change in npxG per game from last season to this season. One thing I find interesting is how it visualises the increase in goals this season (notice the general trend is for lines to move to the left indicating increased npxG conceded per game). This is largely a consequence of the extra time we are seeing.
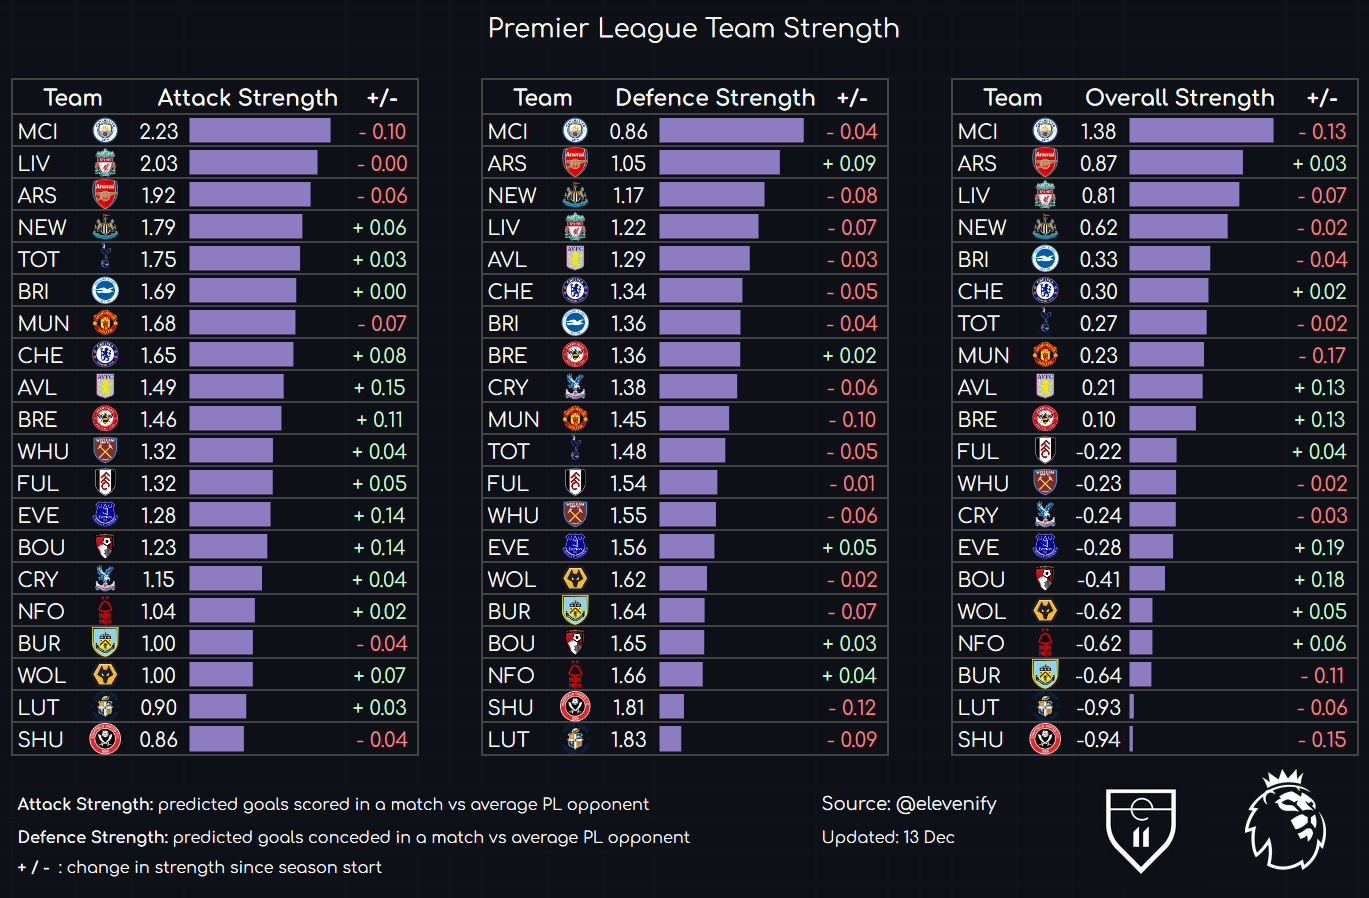
What this equates to in my model is a reduction in relative defensive strength across the board, hence why my model update graphics (below) generally show increases in attack and reductions in defence across the board.
In this context, I generally find any defensive strength improvement to be impressive. So, yeah… I think people still don’t realise how insane Arsenal’s +0.09 defensive strength increase is.
Thank you for reading! Please do reach out if you want me to gift you access to see the full data page - no commitment is required at all!
Much love ✌️


