Team Strength: The Season So Far
What has changed after 12 games?
Hello 👋 this post provides brief insights into all 20 Premier League teams, offering approximately 100 words on each team's season performance. Designed to respect your time and give a quick view of my team strength model changes.
Quick Housekeeping
Just a reminder that the Premier League Data page is the main home for all my projections, including goals, assists, clean sheets, win%, etc. I update this page before anywhere else so feel free to bookmark it and check there.
If you are reading this by email then the length may be too long and the email cuts off. I recommend clicking to view this in browser at the top.
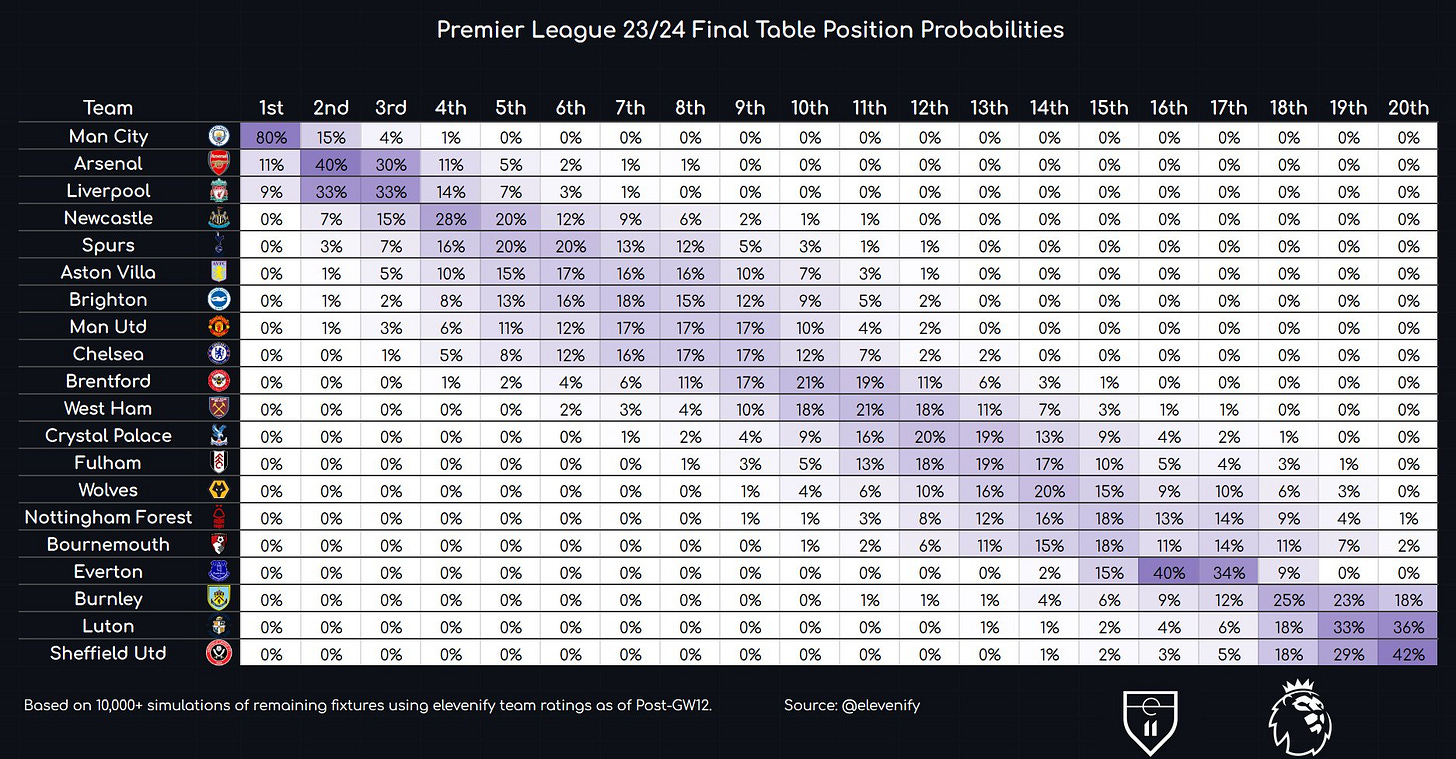
Below is a full snapshot of current team strengths and my latest final table simulation. I run through each team's numbers in their respective sections but you may want to refer back to these complete images for the entire context.
Arsenal
Actual Position in table: 3rd
Expected Position in table: 4th
Model Predicted Finish Position: 2nd (40% chance)
Arsenal’s season so far is fairly simple to characterise: a shift towards control. Whilst the attack has fallen off quite a lot it is being made up for with an incredible defence strength increase. No other team has improved their defence as much as Arsenal’s +0.07. For context, Forest are the second biggest improver with +0.03. This defensive feat is particularly significant in a season witnessing overall declining defensive ratings due to increased goal counts. Arsenal's defensive strength is anchored in their status as "Field Tilt FC," boasting an average possession of 68.11%, second only to Man City.
Aston Villa
Actual Position in table: 5th
Expected Position in table: 6th
Model Predicted Finish Position: 6th (17% chance)
Aston Villa are a bizarre case. They have run a little bit hot and produced a weird set of results. They put 6 past Brighton and have comfortably beaten lower opposition. However, their tests against the top teams resulted in a 0-3 loss to Liverpool and a 1-5 loss to Newcastle. Despite this, my model numbers still have their attack with an impressive +0.09 increase. I receive a lot of comments that I am still too low on their attack. Maybe a bit, however, I think the priors aren’t updating too slowly. They were 9th in the league for npxG last season and are currently 4th this season. Honestly, I am still not quite sure what they are yet - but a fight for a Champions League spot is there for them if the bounces keep falling their way.
Bournemouth
Actual Position in table: 16th
Expected Position in table: 17th
Model Predicted Finish Position: 15th (18% chance)
Bournemouth’s win over Newcastle was comprehensive and perhaps the first real positive outcome from Iraola’s time. Many were curious how Iraola would do in league but worried whether he'd get the time. Despite this result, his ideas have been simmering even when results were bad. League rank: 4th for goal-ending high turnovers. 6th for PPDA. 7th for Build-up Disruption. Surprisingly, my model numbers suggest that there has been no change in Bournemouth’s defensive strength and all their improvements have come in attack.
Brentford
Actual Position in table: 11th
Expected Position in table: 7th
Model Predicted Finish Position: 10th (21% chance)
After years of modellers being high on Brentford, they continue to impress us. The response to how they will cope without Ivan Toney is that they are the biggest relative improvers in attack strength, increasing by +0.10 since the start of the season. This has been achieved whilst maintaining their 8th-place defensive strength. The improvement this season has seen their overall strength move from minus numbers into positive numbers - emphasising their status as an above-average team in the league now.
Brighton
Actual Position in table: 8th
Expected Position in table: 8th
Model Predicted Finish Position: 7th (18% chance)
I have said before that the De Zerbi miracle was generating stratospheric improvements in attack whilst maintaining most of the defence strength. This continues to be the case as there has been relatively little change in their strength since the start of the season. Brighton’s defence has got worse, but 0.02 reduction is relatively modest. The way this has mapped onto results has not been so straightforward, with a very strange cliff of results: W-W-L-W-W-W-L-D-L-D-D-D. Pick your narrative: variance? Struggling with Europe? Did people work RDZ out?
Burnley
Actual Position in table: 20th
Expected Position in table: 19th
Model Predicted Finish Position: 18th (25% chance)
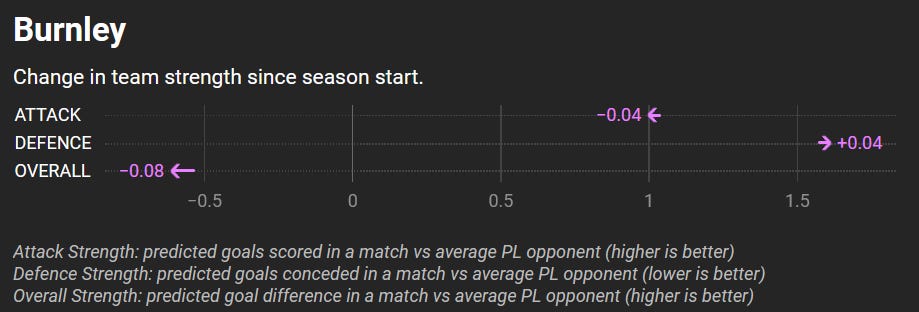
Kompany’s Burnley have stuck to their principles and tried to play the same kind of football they got them promoted but the outcome is much like Norwich’s previous efforts. My model, like the markets and many others, was still relatively high on Burnley coming into the season. There was an assumption they would be the best of the promoted teams and by a reasonable margin. This has seemed very far off the mark and my model is adjusting accordingly with Burnley receiving even 0.04 reductions in attack and defence strength so far. I think the model is still too high on them and there are more strength reductions to come. Burnley is perhaps another example of the merits of Brentford’s promotion model of pragmatism and adaptability.
Chelsea
Actual Position in table: 10th
Expected Position in table: 5th
Model Predicted Finish Position: 8th - 9th (equal 17% chance)
I wrote in October that I think Chelsea are in a pretty good place under Pochettino and a lot of what I said remains true. You can read that piece here so I will just reiterate the main point: Chelsea’s underlyings have been really good all season and they have been one of the unluckiest teams in the league. Chelsea have improved a lot in attack whilst maintaining their defensive solidity. Looking at xG data from FBref, shows that the loss to Brentford is still the only game that Chelsea have not won on xG (and it would be fair to caveat that result due to the nature of Brentford’s last-minute second goal against an open goal). Looking forward to adding Nkunku to this mix.
Crystal Palace
Actual Position in table: 13th
Expected Position in table: 13th
Model Predicted Finish Position: 12th (20% chance)
Over the past 2 years, Crystal Palace have been a little bit of a model gem from a defence perspective. They started this season as roughly the ~7th best defensive team and I believe they thoroughly deserved this. Unfortunately, they have been quite disappointing defensively this season with a rather large 0.07 reduction in defensive strength. This has been offset by a 0.03 increase in attack strength, largely fueled by the uptick in production from Edouard.
Everton
Actual Position in table: would be 13th (without points deduction)
Expected Position in table: would be 9th (without points deduction)
Model Predicted Finish Position: 16th (40% chance with points deduction)
Admittedly, Everton have been a little bit of a model lovechild of mine this season. There were signs from very early on in the season that something had changed. Everton got themselves into one of the largest finishing deficits at the start of a season I can remember (just 2 goals from ~8 npxG in the first 4 games). Despite this, the underlying numbers looked very good - way beyond just the xG, there were positive movements in xThreat and Field Tilt that suggest there have been healthy systematic improvements. Despite the points deductions, I think Everton have enough to survive given their strength increase and how bad the quality is at the bottom this season.
Fulham
Actual Position in table: 15th
Expected Position in table: 16th
Model Predicted Finish Position: 13th (19% chance)
At the start of the season, I noticed my model was somewhat alone in its assessment of Fulham. I had Fulham as being the 13th-best team overall. Every other modeller that I checked had Fulham as worse than that by a somewhat reasonable margin. In a perhaps somewhat uninteresting development, Fulham’s performances have been almost entirely in expectation with the model numbers and their overall rating has remained virtually unchanged. They currently are still the 13th best team overall - just with a lot smaller margin as other teams closed the gap. Replacing Mitrovic with Jiminez but not losing any attack strength seems like a mild success to me.
Liverpool
Actual Position in table: 2nd
Expected Position in table: 2nd
Model Predicted Finish Position: 2nd - 3rd (equal 33% chance)
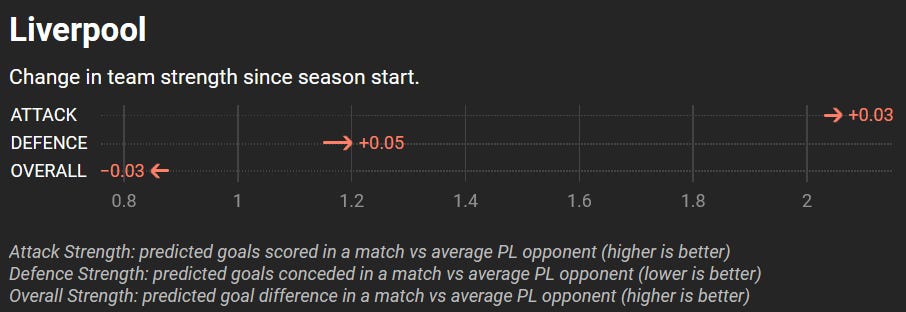
If there is a title race this season, Liverpool are in it. Liverpool’s attack has clicked this season and my model has their attack strength moving from an already impressive 2.03 to 2.06. This is evidenced by currently topping the npxG table with 23.2. Defence strength has declined a fair amount but I think this is a combination of me being slightly too high on them to begin with and the increase in goals per game across the board this season.
Luton Town
Actual Position in table: 17th
Expected Position in table: 17th
Model Predicted Finish Position: 20th (36% chance)
Luton have been a minor surprise. Their attack has been a lot stronger than expected - their +0.06 in attack is the only model improvement in any metric for any of the promoted sides. Despite this, they are still in a relegation fight due to their defence being even worse than expected. A -0.08 reduction in defence strength leaves Luton with the worst defence in the league, at 1.82.
Man City
Actual Position in table: 1st
Expected Position in table: 1st
Model Predicted Finish Position: 1st (80% chance)
It is tough at the top. City’s underlying numbers have been trending down for a while now. This shouldn’t be surprising given the lack of KDB and other notable absences. However, there is no cause for concern. People react dramatically when they see that ‘City are getting worse’ but it must not be forgotten how stratospherically ahead of every other team they are. Check any of my graphics and they are ahead of everyone else ruining the graph scale. Even with a blank upcoming in GW18 they have the most goals projected. My numbers still have them at 80% to win the league.
Man United
Actual Position in table: 6th
Expected Position in table: 11th
Model Predicted Finish Position: 7th - 9th (equal 17% chance)
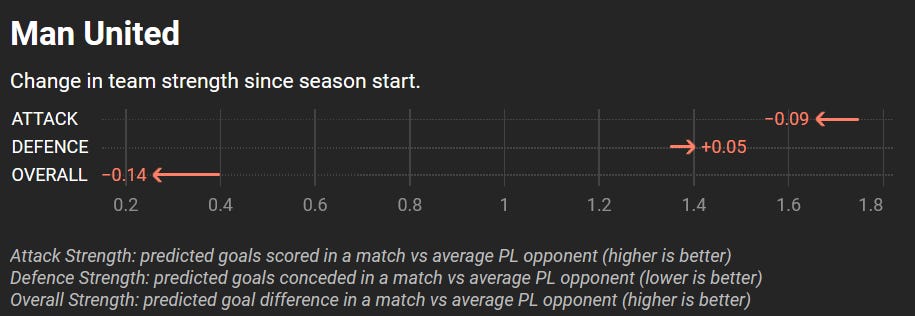
Manchester United have been really poor this season. We can spin it however we like but the reality is their on-field performances resemble an above-average midtable side. They are 11th for npxG, 13th for npxG conceded, 11th for xGD, and 7th for xThreat. Despite all this, they have managed to pick up some undeserved results and sit 6th in a table where they should be 11th. Man United have seen the biggest team strength decrease in my model, with a -0.14 in overall strength coming from -0.09 in attack and +0.05 in defence. If injuries really are the cause like many are pointing to then perhaps there is a world where people like Shaw come back and magically perform to expectation again and get a very good finish.
Newcastle
Actual Position in table: 7th
Expected Position in table: 3rd
Model Predicted Finish Position: 4th (28% chance)
Newcastle were always going to be one of the biggest tests for the model this season. At the start of the season, I had them as comfortably the 4th best overall team with the 2nd best defence strength. Newcastle’s on-field performances have largely met the high expectations and not much in their team strength has changed. They are still the 4th best team but with a significant gap to close on the top 3. However, the recent performance in the loss to Bournemouth was poor and they continue to struggle with key absences. The trajectory of their season will likely depend on how well they can reinforce a relatively thin squad in January.
Nottingham Forest
Actual Position in table: 14th
Expected Position in table: 15th
Model Predicted Finish Position: 15th (18% chance)
Nottingham Forest are an interesting case from a model perspective. When I look at other models and markets there is a lot of talk about Forest’s improvement. Yes, Forest have improved both their attack and defence, but my numbers seem significantly more pessimistic than everywhere else. It is important to put it in perspective. They have improved from being a clear relegation candidate to not being one, just by virtue of how bad the promoted teams are this season. In any other season, there would be cause for concern: they are 15th for xGD and are expecting to be without the main source of their xG Awoniyi for 3 months.
Sheffield United
Actual Position in table: 18th
Expected Position in table: 20th
Model Predicted Finish Position: 20th (42% chance)
I don’t have much to say about Sheffield. Only United stop them from being the team with the biggest strength reductions this season. Sheffield United have basically been the football version of the ‘our expectations for you were low but holy f*ck’ meme. They sit at 18th in the actual table but with underlyings of 20th for xG, 20th for xGA, 20th for xGD, 20th for xT, 19th for xThreat Against, 19th for Possession, and 19th for Field Tilt.
Tottenham
Actual Position in table: 4th
Expected Position in table: 10th
Model Predicted Finish Position: 5th - 6th (equal 20% chance)
The lack of Maddison will get all of the attention but the reality is that, despite some genuine improvement, Tottenham have been running very hot this season. They sit 4th in the table when their expected position will sit them around 10th. Many will comment that expected metrics will never properly account for elite finishers such as Son - but the reality is that even elite finishing skill does not bridge this much of a gap. There are clear on-field stylistic changes and more improvements will come - just don’t let this start to the season fool you into thinking it won’t take time.
West Ham
Actual Position in table: 9th
Expected Position in table: 12th
Model Predicted Finish Position: 11th (21% chance)
Pack up your stereotypes, we’re going on a journey. A David Moyes is trading defence strength for attack strength. West Ham’s attack has improved by 0.04 at the expense of a 0.06 reduction in defence strength. Don’t drop all your stereotypes though, some may think this has come about in a way that is still very ‘Moyesian’. West Ham’s attack is fueled by them being 3rd in the league for xG created by set pieces and counter-attacks - this being paired with them being 18th for PPDA, 20th for build-up disruption and 19th for pressing. You do not have to look too hard to see the game model here.
Wolves
Actual Position in table: 12th
Expected Position in table: 14th
Model Predicted Finish Position: 14th (20% chance)
Wolves have seen some good improvements this season. I have been notoriously low on Wolves for quite some time now, particularly in the attack department. There is a case to be made that perhaps the defensive improvement my model is seeing is simply ‘catching up’ and in reality they are even better than I think, but I think it is fair to be skeptical about an attack that relies so heavy on dribbles (1st in the league) for chance creation. One injury to key dribblers like Neto scuppers this entirely and they have to look elsewhere - currently they rank 15th for cutbacks, 12th for crosses, and 16th for through balls.


